You have administered and scored the CBM, now what?
After all three baselines have been administered, you can read about that here, average the scores and plot the point on the graph. I am using a paper graph that I have made, you will see examples below.
The unique baseline for each student has been determined, now a goal needs to be set. Just like scoring, there are options for goal setting. Options include end-of-year benchmarking, rate of improvement, and intra-individual framework. I chose to use the rate of improvement for goal setting. For the first round, I am collecting data over a 10 week period. Since the amount of time is so short, by using the rate of improvement, I can easily see how students are responding to interventions.
The rate of improvement option uses national norms of improvement. The chart below is what I use to calculate the growth slope.

Baselines have been recorded, goals have been set, now it’s time to plot the weekly CBM probes! Lines are drawn to connect each data point.
I am including a few examples of my 4th and 5th grade math students below. For each student I drew both the realistic and ambitious goal.
Student A (5th)
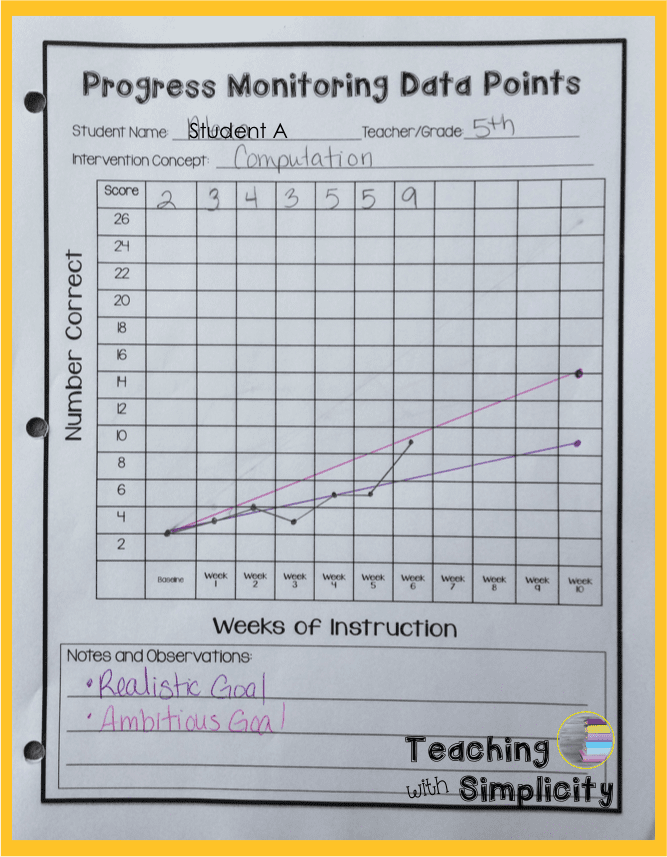
- Baseline: 2
- Realistic Goal: (0.75 x 10 + 2 = 9.5)
- Ambitious Goal: (1.2 x 10 + 2 = 14)
Student B (5th)
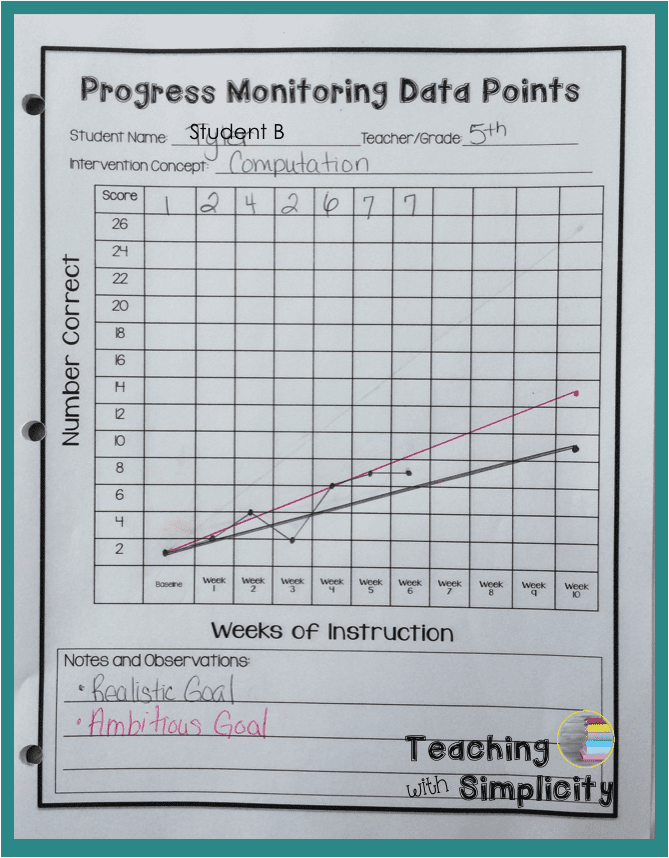
- Baseline: 1
- Realistic Goal: (0.75 x 10 + 1 = 8.5)
- Ambitious Goal: (1.2 x 10 + 1 = 13)
Student C (4th)
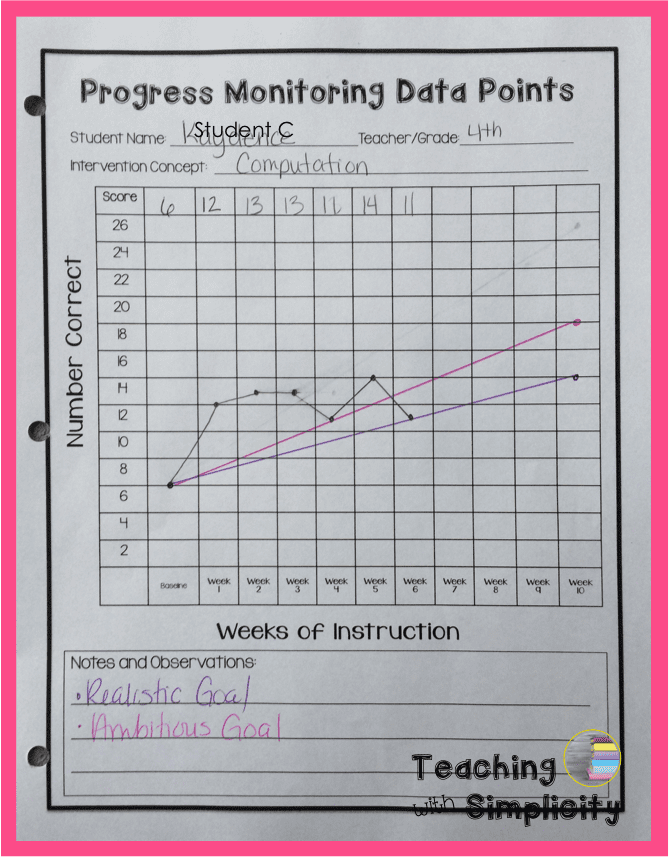
- Baseline: 6
- Realistic Goal: (0.70 x 10 + 6 = 13)
- Ambitious Goal: (1.15 x 10 + 6 = 17.5)