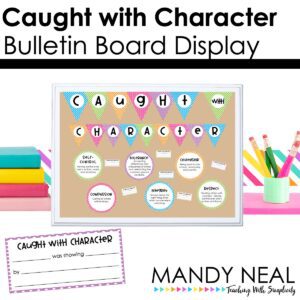
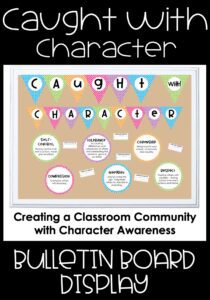
Caught with Character is a bulletin board that I use in my classroom. It’s fun, interactive, and allows students to highlight the good character they find fellow classmates engaged in.
My Set-up
- Add the words slowly, giving students time to become familiar with the trait. I have added one word monthly and I have also added them bi-monthly.
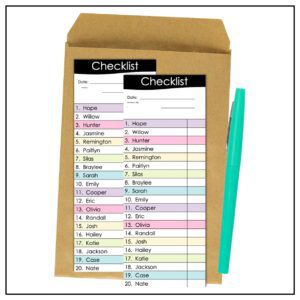
- Have slips of paper available for students to write down the good character they witness.
- Provide easy access to thumb tacks or a stapler for students to post their slips.
- At the end of the week, as the board has a tendency to get filled up, I remove the Caught with Character slips and pass them back to students so they can take them home and share.
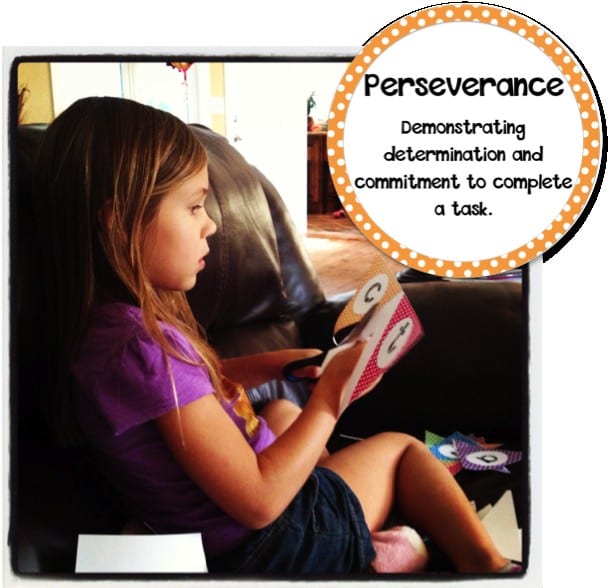
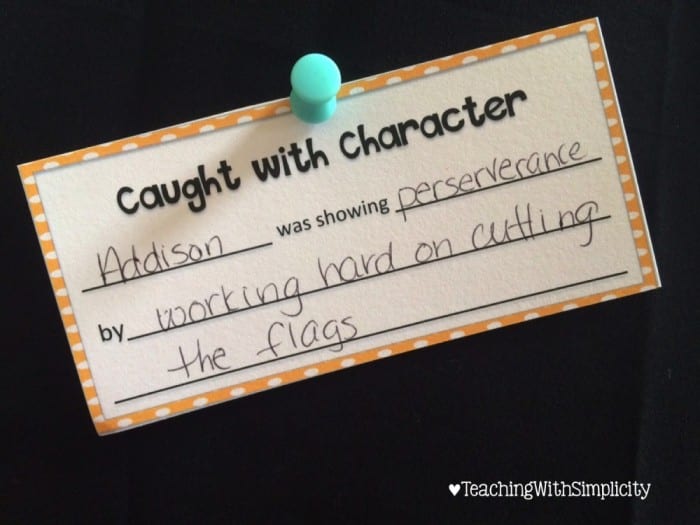
(This is my daughter helping me cut out the bulletin board pieces. She is quite a talented kindergartener. So much so, that I trusted this six-year-old to help cut out the pieces. This mama is proud! 🙂 )
What Has Just Happened?
- Students that may get overlooked for good character otherwise, receives recognition from peers.
- Students reflect, they see a classmate showing good character they reflect on their own.
- Students love to be acknowledged for the good that they do!
Like What You See?
You can find the Caught with Character Bulletin Board Display HERE.